
Key science outputs
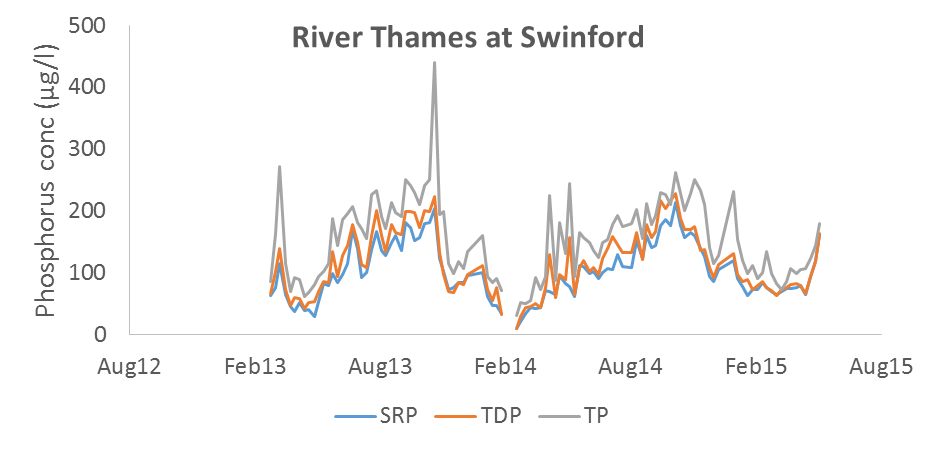
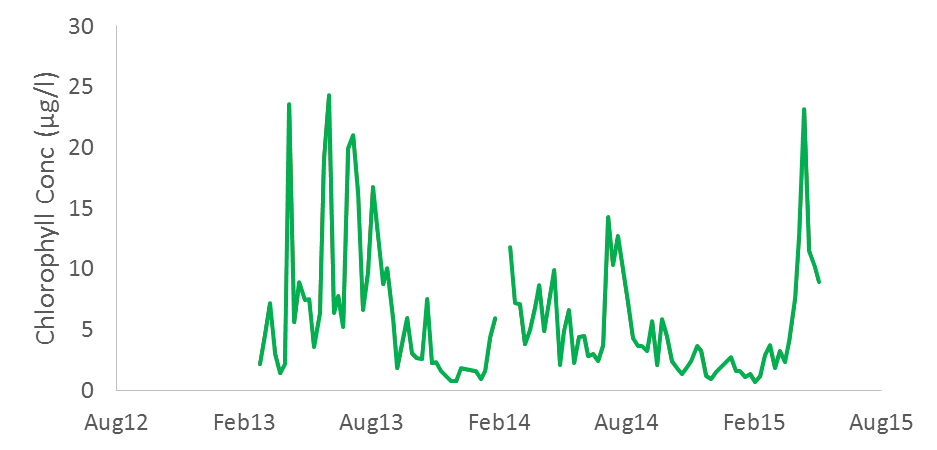
- Complete 2 year water-quality data set of River Thames at Swinford
- Complete 2 year water quality data set of Farmoor reservoir
- Accompanying phytoplankton characterisation by flow cytometry
Introduction
Task B4 generated the weekly water quality and biological data from two sites on the River Thames and Farmoor reservoir. These were the key data required to investigate how changes in nutrients and flow would affect phytoplankton ecology and the likelihood of algal blooms.
Research methods
Samples were manually sampled at weekly intervals and analysed at the CEH Wallingford laboratories using standard protocols.
Phytoplankton characterised by Flow Cytometry.
Further information
- Bussi, G., P. G. Whitehead, M. J. Bowes, D. S. Read, C. Prudhomme & S. J. Dadson, 2016. Impacts of climate change, land-use change and phosphorus reduction on phytoplankton in the River Thames (UK). Sci Total Environ doi:http://dx.doi.org/10.1016/j.scitotenv.2016.02.109.
- Whitehead, P. G., G. Bussi, M. J. Bowes, D. S. Read, M. G. Hutchins, J. A. Elliott & S. J. Dadson, 2015. Dynamic modelling of multiple phytoplankton groups in rivers with an application to the Thames river system in the UK. Environmental Modelling & Software 74:75-91 doi:http://dx.doi.org/10.1016/j.envsoft.2015.09.010.