
Key science findings or outputs
- Droughts cause reduction in low flows and therefore increase phosphorus concentration in the river due to decreased availability of water to dilute wastewater effluents.
- Climate change is expected to increase drought severity and phosphorus concentration in rivers, but the response of phytoplankton varies depending on the functional group.
Introduction
River water quality is fundamental for ecosystems and water supply. Yet, the impacts of droughts on river water quality are poorly understood, due to lack of extensive data and the non-linear interactions between different natural and human-induced processes. The objective of this work package is to understand how droughts affect nutrients, sediment and phytoplankton in river systems, taking into account the further complexity added by climate change and anthropogenic pressures.
Research methods
In this task, the River Thames is used as a case-study, due to its importance as a freshwater supplier and effluent recipient and to its high conservation value. Hydrological and water quality models are developed to understand the system behaviours. These models are then used to explore the impact of climate variability and land-use change on river water quality. Different methodological approaches are used, such as coupling the water quality models with climate models, or exploring the sensitivity of the water quality models to the climatic input (scenario-neutral methodology).
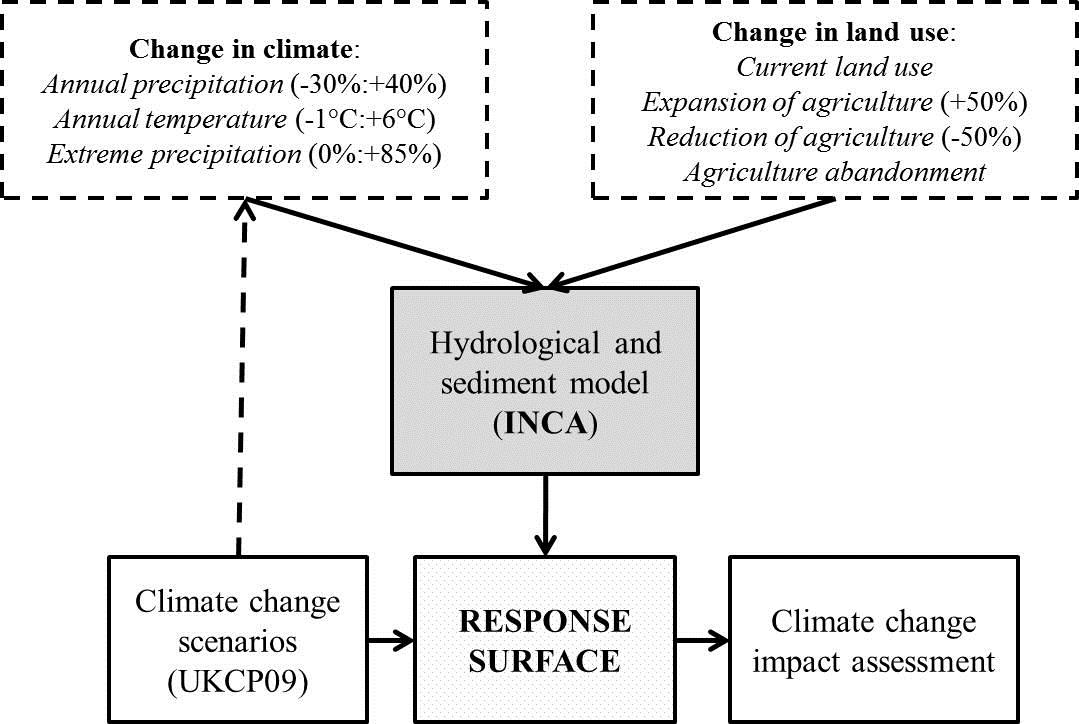
Conceptual scheme of the scenario-neutral methodology applied to a sediment model.
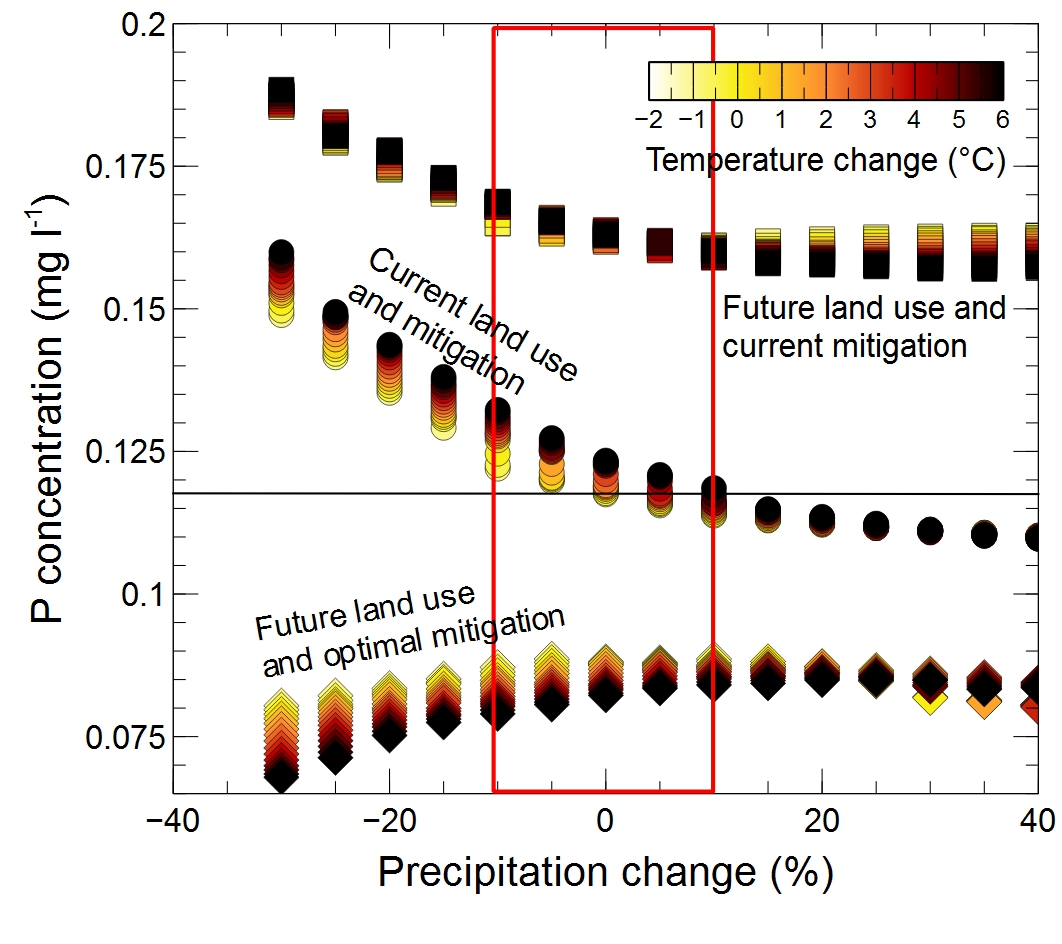
Droughts cause an increase phosphorus concentration in the river due to decreased availability of water to dilute wastewater effluents.
Under current land-use and phosphorus removal mitigation strategies, average phosphorus concentrations range from 0.11 to 0.16 mg L-1, being inversely proportional to precipitation due to the dominance of sewage effluent inputs at this site (Bowes et al., 2015). When an increase in agricultural land use is applied, the average phosphorus concentration increases up to between 0.15 and 0.18 mg L-1. In this case, phosphorus concentration is still inversely proportional to rainfall, although for increases in precipitation greater than 20% this trend inverts and precipitation is directly proportional to phosphorus concentration. This suggests a shift from a point source-dominated to a diffuse source-dominated regime, due to the joint effect of increased rainfall and expansion of agricultural land. The average phosphorus concentration drops to 0.07-0.09 mg L-1 if a combined phosphorus removal strategy is implemented.
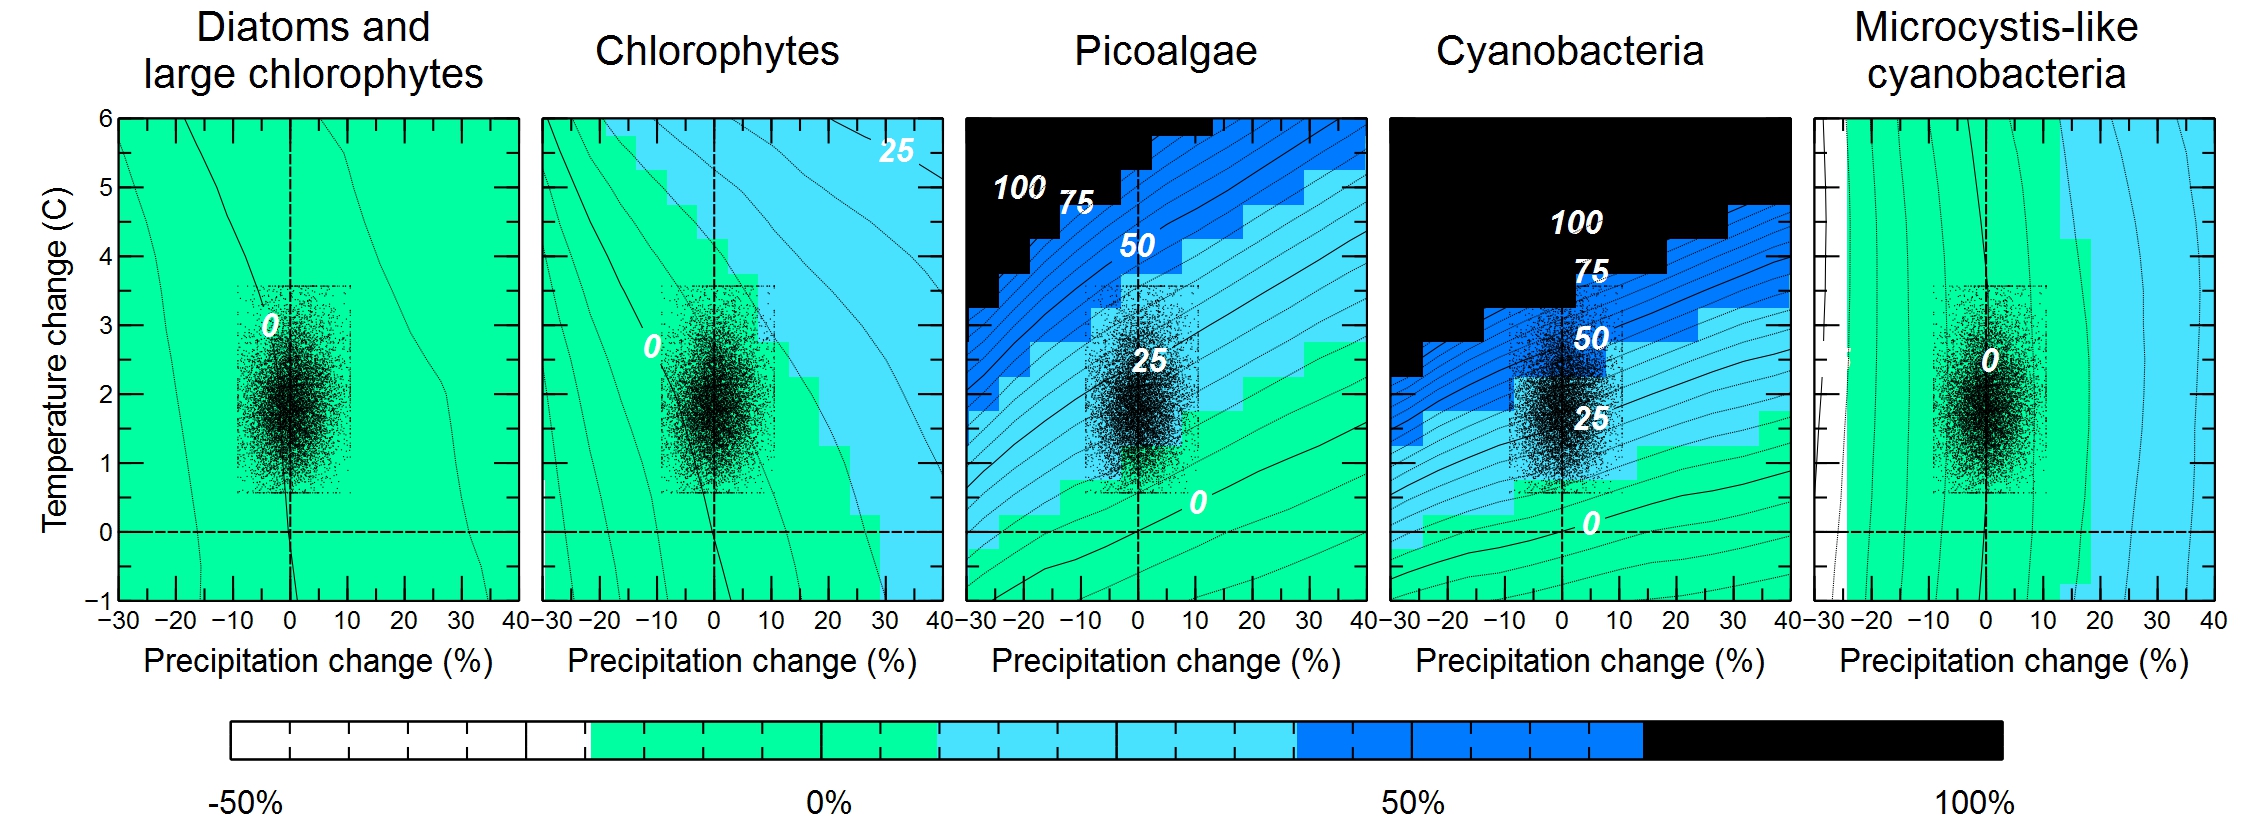
Climate change is expected to increase drought severity and phosphorus concentration in rivers, but the response of phytoplankton varies depending on the functional group.
Precipitation, and hence flow, is the key control for Microcystis-like cyanobacteria and diatoms and large chlorophytes: i.e. phytoplankton concentration is much more sensitive to changes in precipitation than to changes in temperature. Temperature is the main control for cyanobacteria – although cyanobacteria are also sensitive, to a lesser extent, to changes in precipitation. Picoalgae appear to be driven by both precipitation and temperature. Similarly, Chlorophytes are driven by both climatic stressors, although for low values of temperature change, precipitation seems to prevail as the key control.
The sensitivity of phytoplankton to climate change is smaller for diatoms, chlorophytes and Microcystis-like cyanobacteria and higher for picoalgae and cyanobacteria. For example, while cyanobacteria can double their average concentration in reach 1 for an increase in temperature of +3°C, chlorophytes only show an increase between 5 and 10%.
Chlorophytes, diatoms and Microcystis-like cyanobacteria decrease their concentration along with precipitation, while cyanobacteria and picoalgae increase it.
Further information
Visit the Droughts, people and environment dashboard here
- G. Whitehead, G. Bussi, M.J. Bowes, D.S. Read, M.G. Hutchins, J.A. Elliott, S.J. Dadson. 2015. Dynamic modelling of multiple phytoplankton groups in rivers with an application to the Thames River system in the UK. Environmental Modelling & Software. 74, 75-91. doi:10.1016/j.envsoft.2015.09.010.
- G. Bussi, P.G. Whitehead, M.J. Bowes, D.S. Read, C. Prudhomme, S.J. Dadson. 2016. Impacts of climate change, land-use change and phosphorus reduction on phytoplankton in the River Thames (UK). Science of the Total Environment. doi:10.1016/j.scitotenv.2016.02.109.
- G. Bussi, S.J. Dadson, M.J. Bowes, P.G. Whitehead. 2016. Using sediment rating curves to identify the effect of seasonal and inter-annual disturbances on the sediment transport of the River Thames (UK). Journal of Hydrological Engineering.
- G. Bussi, S.J. Dadson, C. Prudhomme, P.G. Whitehead. 2016. Climate and land-use change impacts on sediment transport in the River Thames (UK). Journal of Hydrology.
- G. Bussi, S. Dadson. 2015. Analysis of the fine sediment dynamics in the River Thames catchment (UK) using a sediment rating curve approach. Geophysical Research Abstracts. EGU General Assembly 2015. Vienna, Austria. April 2015. ISSN 1029-7006. Open presentation
- G. Bussi, P. Whitehead, M. Bowes, D. Read, S. Dadson. 2015. Dynamic modelling of five different phytoplankton groups in the River Thames (UK). Geophysical Research Abstracts. EGU General Assembly 2015. Vienna, Austria. April 2015. ISSN 1029-7006. Open poster
- G. Bussi, P. Whitehead, S. Dadson. 2016. Modelling climate change, land-use change and phosphorus reduction impacts on phytoplankton in the River Thames (UK). Geophysical Research Abstracts. EGU General Assembly 2016. Vienna, Austria. April 2016. ISSN 1029-7006. Open presentation
- G. Bussi, S. Dadson, P. Whitehead. 2016. Modelling the impacts of climate and land-use change on the sediment transport of the River Thames (UK). Geophysical Research Abstracts. EGU General Assembly 2016. Vienna, Austria. April 2016. ISSN 1029-7006. Open poster
Videos