Agriculture, due to its dependence on weather conditions, is one of the most severely affected sectors by droughts and water scarcity. In humid climates, supplemental irrigation is an essential component of production not for boosting yield but for quality assurance, to meet the premium quality criteria demanded by the major processors and retailers. In MaRIUS, we are looking at the financial impacts of farmers not having enough water to irrigate their crops during droughts. According to our results, the financial benefits of irrigation in England and Wales in a dry year are higher than £650 million at the farm level. The impacts of droughts on the farm are transmitted along the fresh produce supply chain, from the farm to the consumer, via packers, processors, supermarkets and retailers. Understanding how these impacts are transmitted and how each sector of the supply chain adapts to them is crucial for increasing the resilience of our food supply system.
Drought is an inherent feature of the UK climate. Over the last few decades, farmers have been affected by several droughts in the past, leading to severe impacts on their production. In the Anglian region, where irrigated agriculture is mostly concentrated, farmers have learnt from experience and adapted to droughts, being more resilient to this natural hazard than they were in the 1976 drought. The most crucial factors contributing to this are: a) investment in water resource diversification (i.e, on-farm reservoirs), irrigation scheduling and drought management plans; b) collaboration amongst farmers through Water Abstractors Groups (WAG) and other associations; and c) close collaboration with the water regulator. Our results highlight the importance of a vertically integrated drought management approach for reducing the impacts on agriculture, that not only considers on-farm responses (crucial for adapting to climate change and variability), but also how farmers work together to protect their interests and the pivotal role that the regulator plays in interacting with farmers to provide information and support.
Climate change is expected to increase temperatures, modify rainfall patterns and intensify drought frequency and severity. Consequently, supplemental irrigation in the UK will face an increasing risk of being constrained by the licensing system and abstraction drought restrictions. In MaRIUS, we analyse the impact of climate change on the risk of not meeting crop water demand because of a) abstraction limits in the licences (farmers using all/most of their licenced volume) and b) irrigation abstraction restrictions imposed by the regulator. The results indicate a significant increase in the proportion of the abstraction licence use in all England due to higher irrigation needs. Although the likelihood of drought restrictions is found to increase significantly in central and western England, abstraction licence limit is likely to represent the greatest risk for abstractors in the future, mainly in the most productive agricultural areas located in eastern and southern regions. Our work emphasises the influence of regulatory abstraction constraints on supplemental irrigation and the extent within which it could restrain agriculture in the long term.
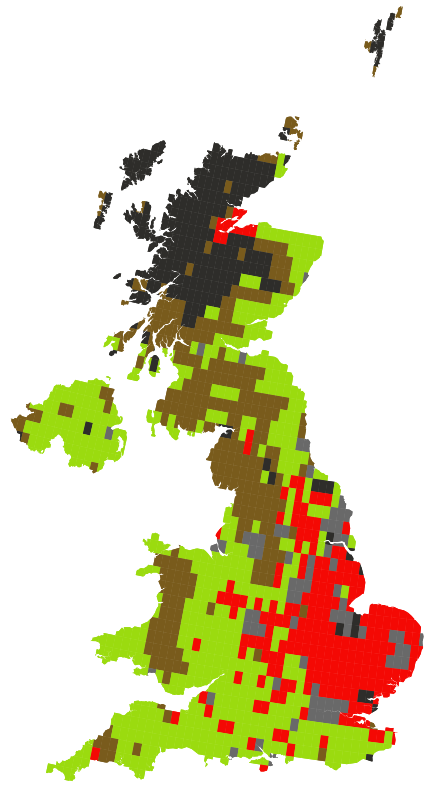
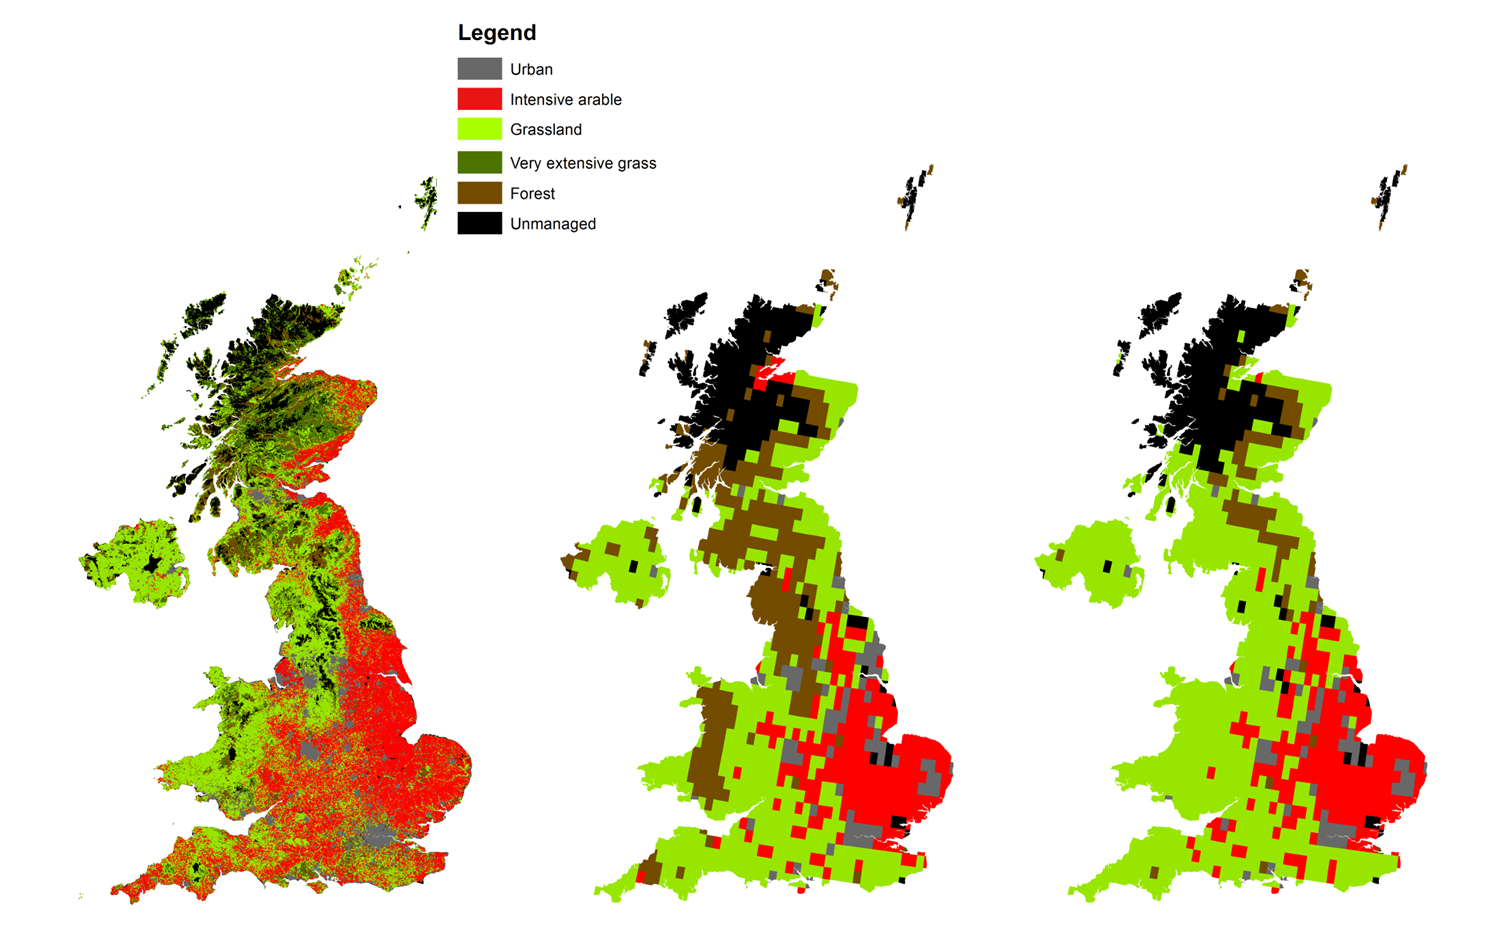
The maps below show potential changes in different land use types (Intensive Farmland/Arable, Grassland, Very Extensive Grassland, Forest, Urban, Unmanaged) under scenarios of increasing temperatures and declining precipitation, simulated using a European rural land use allocation model (details of which can be found here). The model indicates that land use is highly sensitive to small changes in climate, in particular grassland area is especially sensitive to decreased precipitation and arable land to increased temperature. These changes reflect the profitability of these land use types under warmer/drier scenarios.