Key science outputs
-Nested model : Thames basin water resource system; simple and complex versions
Introduction
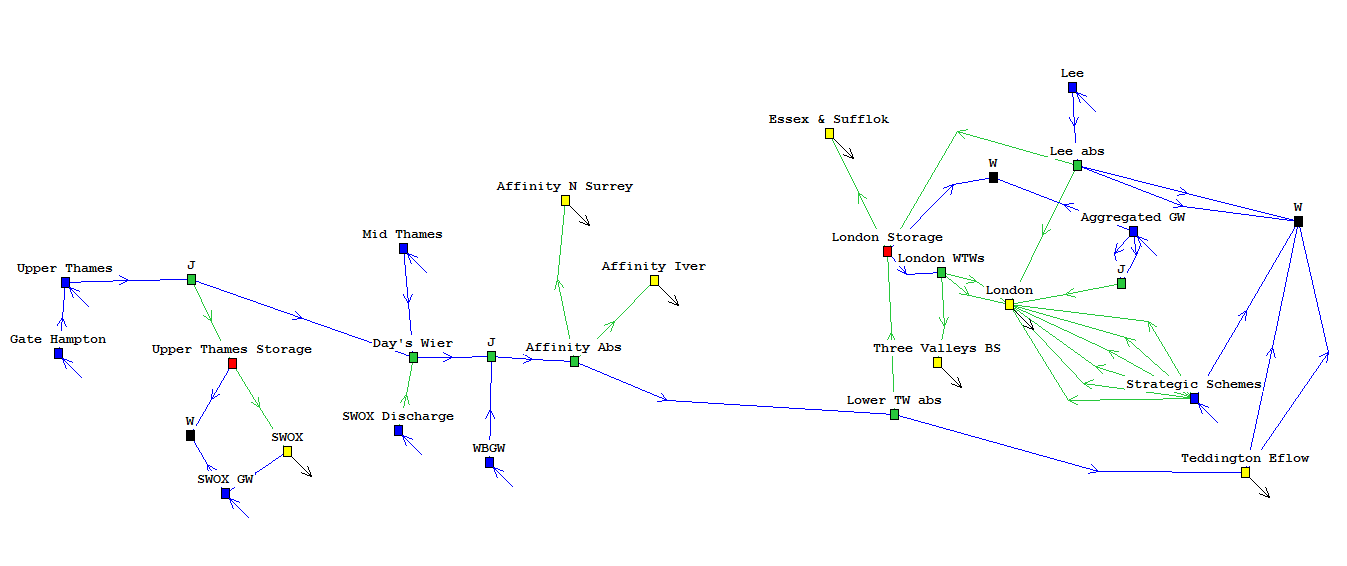
WATHNET has been employed in MaRIUS project to develop Thames basin water resources system. Two version of Thames basin water resources system developed, one captures all the details and complexity of the system while the other one is an aggregated version of the detailed one and it is indeed simplified.

Model specifications
The more detailed and complex model has about 450 arcs and 300 nodes. The 26 surface water sources (river flows in the basin) and 80 groundwater sources serve water to 14 demand centres in the region. The model includes all regulations and constraints in place, i.e. Lower Thames Control Diagram and Teddington flow requirement. The computation time of the model on a desktop computer (3.40GHz) for 30 years period on daily basis is about 3.5 minutes.
A more simplified version of Thames model developed. This model has 30 nodes and 40 arcs. In this model, all demands are aggregated to two nodes and all Lower Thames storages presented in one node. The computation time on a desktop computer (3.4 Ghz) for 30 years period on daily basis is about 2.5 seconds.
Model validation
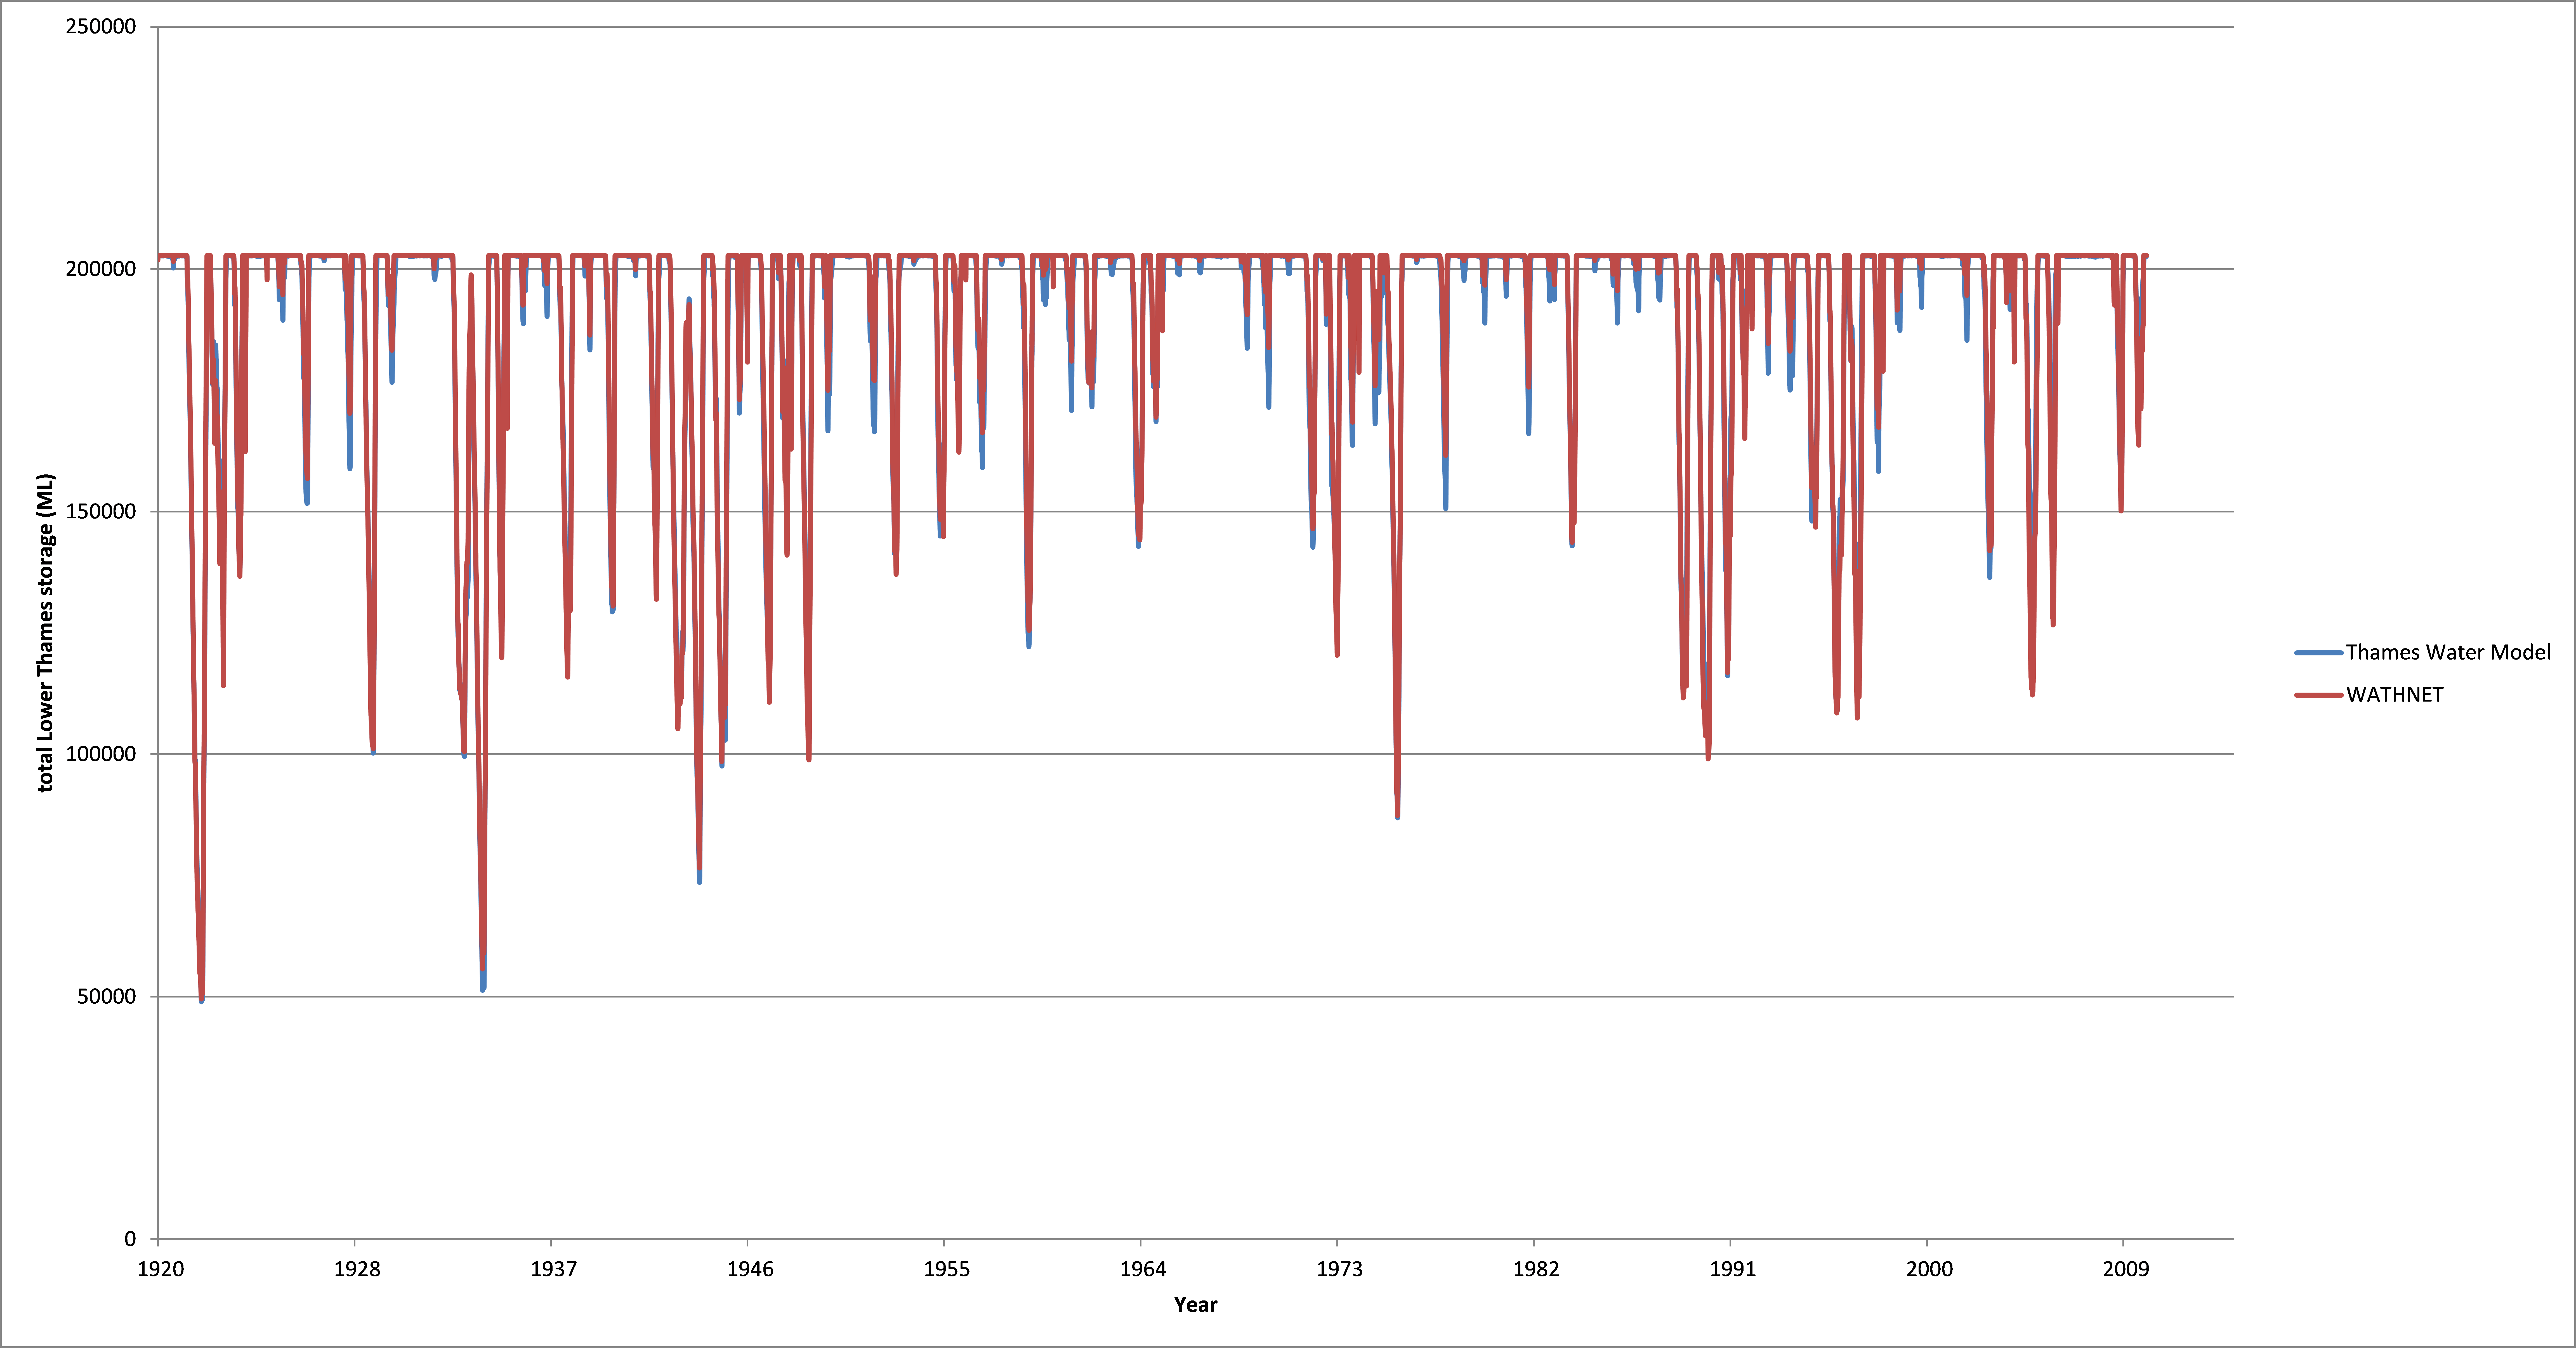
Both simplified and detailed models are validated against Thames Water model to make sure the models are not biased and the regulations and rules are as expected. This has been done by comparing selected outputs of WATHNET model with Thames Water model. One of the best outputs is total lower Thames storages and how it changes over time as the storage level determines the level of restrictions and required environmental flow at Teddington (Based on Lower Thames Control Diagram).
In Figure 2 the total lower Thames storages of two models are compared. The graph presents compatibility of WATHNET results with Thames Water model.

Further information
Visit the Droughts, people and environment dashboard here


