Key science outputs:
- Future synthetic drought event set: 100 weather time series for near and far future conditions that could occur, using weather@home 2, i.e., the regional climate model HadRM3P driven by its global counterpart, the global climate model HadAM3P (same setup as the “baseline” described here).
Research methods
To estimate future drought risk, a synthetic event set for future time period has been generated, following a similar setup as for the synthetic baseline event set : a global climate model, (HadAM3P, the parent global model of HadRMP), driven by observed sea surface temperature is used to drive HadRM3P (using the weather@home distributed climate modelling system).
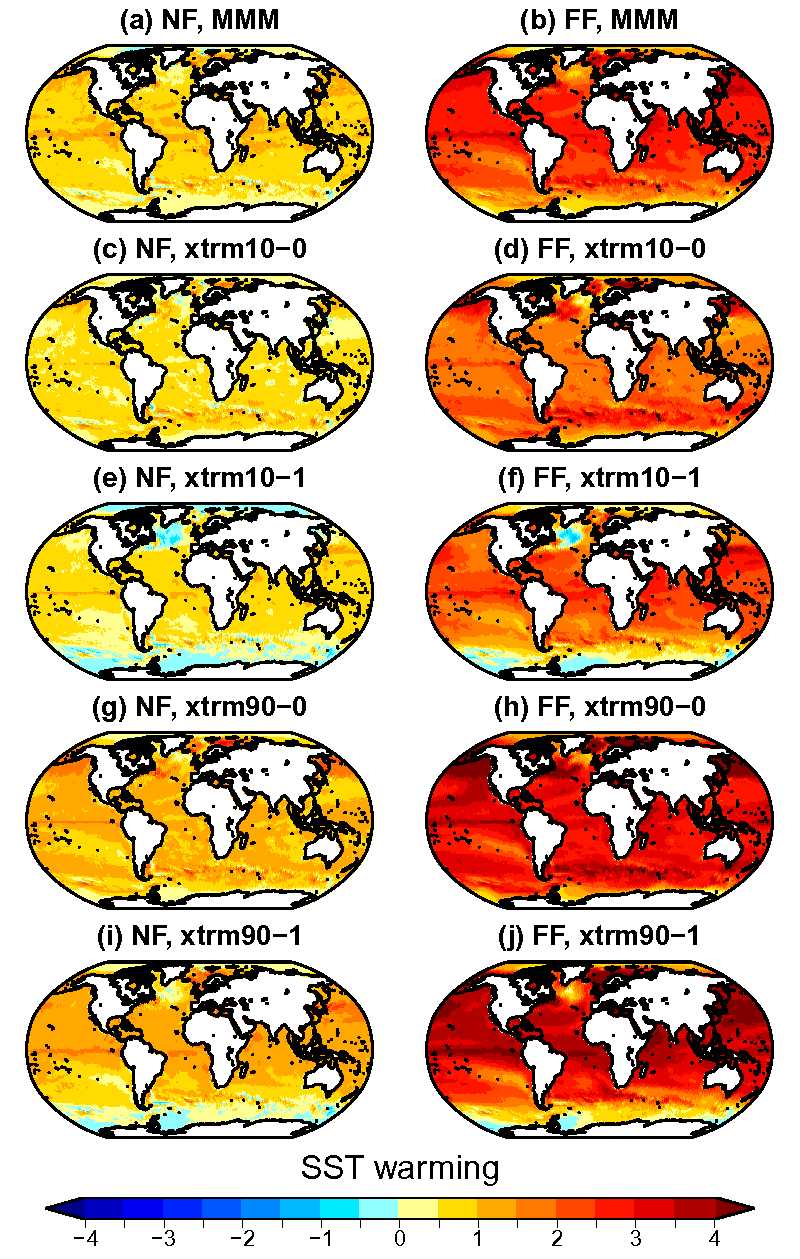
The future event set provides a range of possible weather time series that could occur in the near future (2020-2049) and far future (2070-2099). Projections are based on the high-emission greenhouse gas scenario RCP 8.5. Years 1975-2004 in the past are used as a reference: volcanoes and sea surface temperature anomalies are taken from those years, with a projected warming added onto the latter. The uncertainty of the climate response is included by considering 5 scenarios of ocean warming: an average scenario (multi-model median of coupled climate model warming) and 4 extreme scenarios, with high/low global average warming and high/low change in North Atlantic sea surface temperature gradients, sampled from the CMIP5 ensemble. About a hundred time series have been produced for each scenario and time slice, leading to a total of 10 sets of a hundred 30-year time series. The mean sea surface temperatures warming is shown in the figure below for near future (NF, left) and far future (FF, right) for the average scenarios (top row) and the 4 alternative scenarios.
Preliminary Results
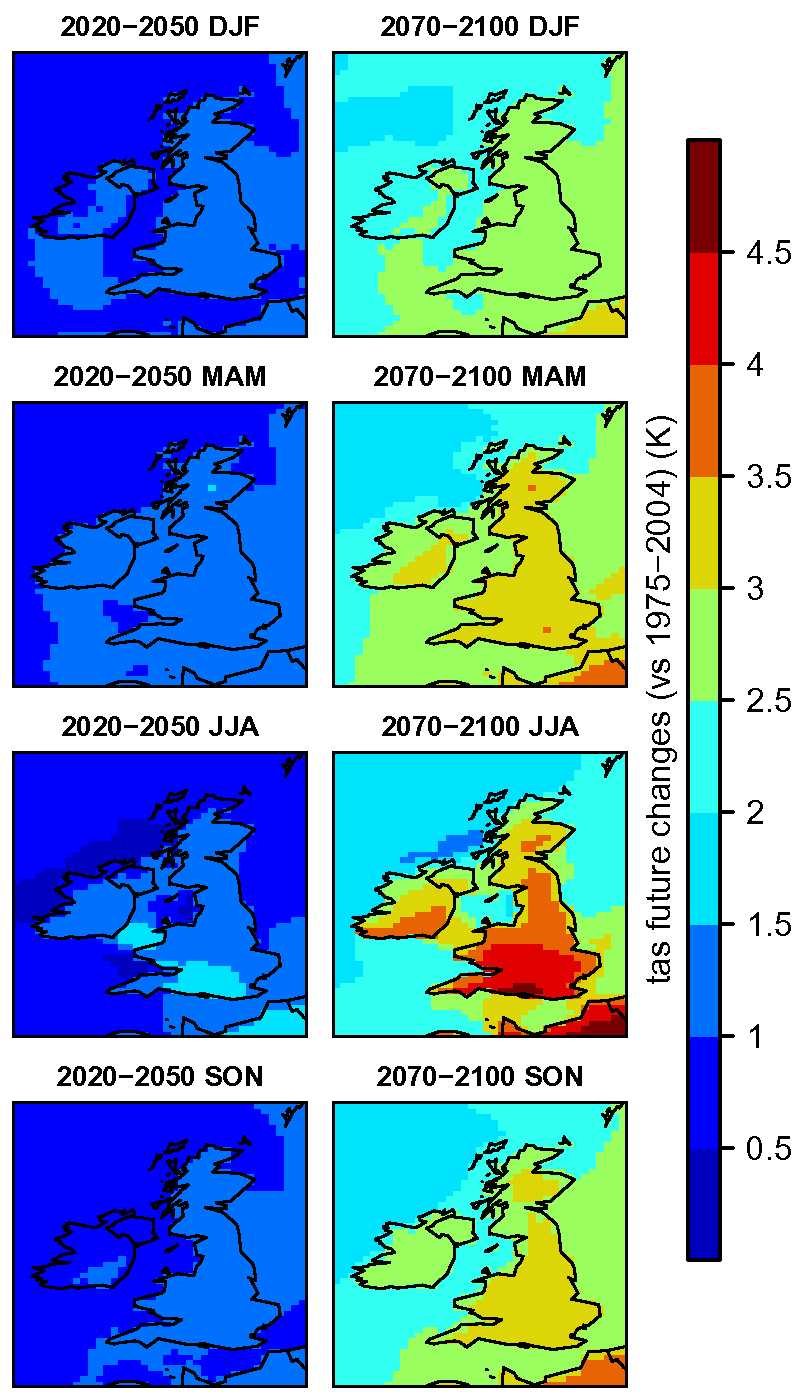
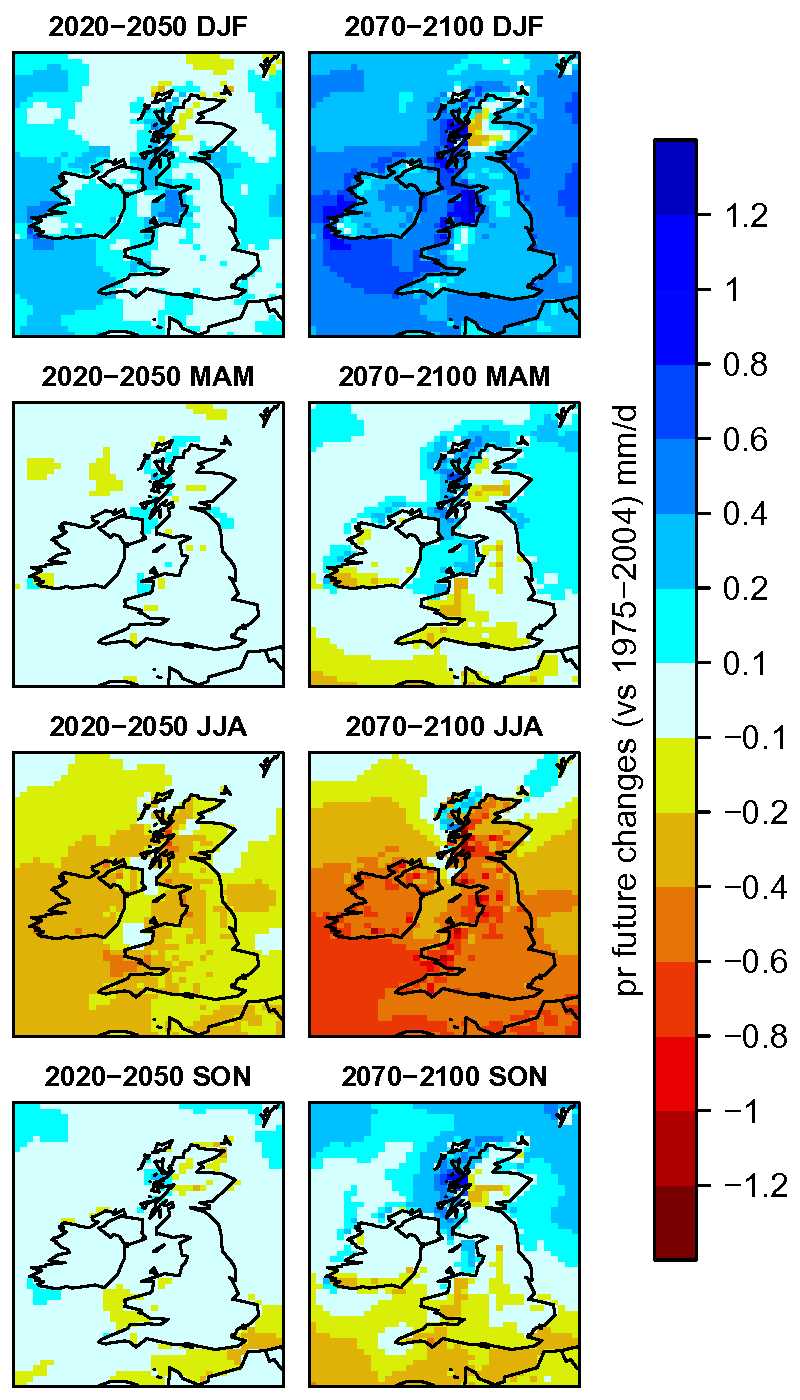
The results below show the changes in seasonal averages of temperature and precipitation for each season and future time slice in the future events set, relative to 1975-2004 in the baseline. Projections show that the temperature increase is most pronounced in summer. For precipitation, winters get wetter while summers become summer dryer, which has implications for droughts.
Datasets
see drought datasets
Videos